
Features
DockDash combines update monitoring, service health, resource history, and day-to-day container operations in a single self-hosted interface.
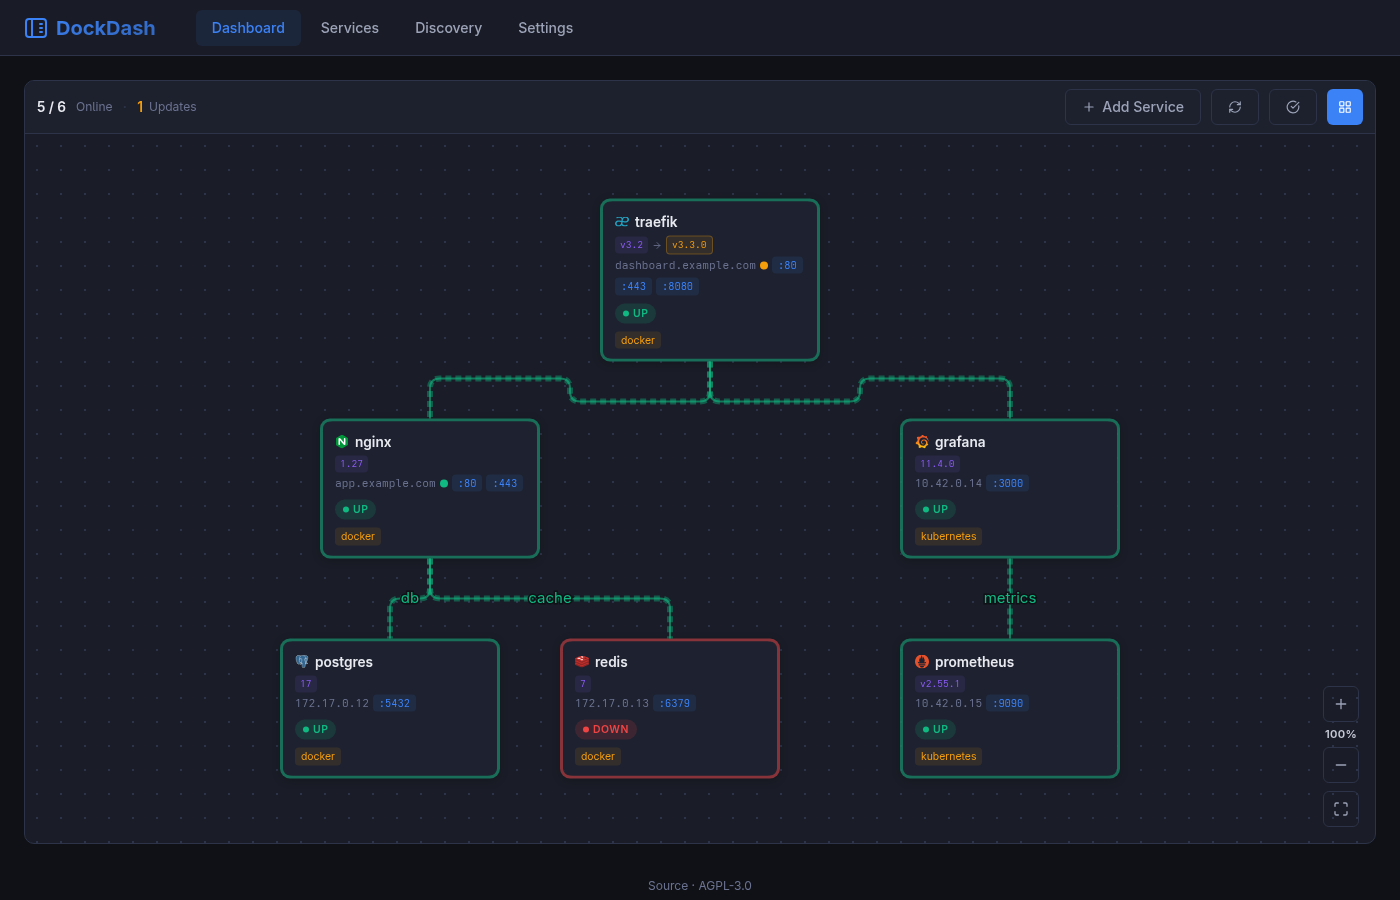
Interactive dashboard
Section titled “Interactive dashboard”Arrange services on a freeform canvas, draw labeled connections, group related workloads, and keep live health and update state visible at a glance.
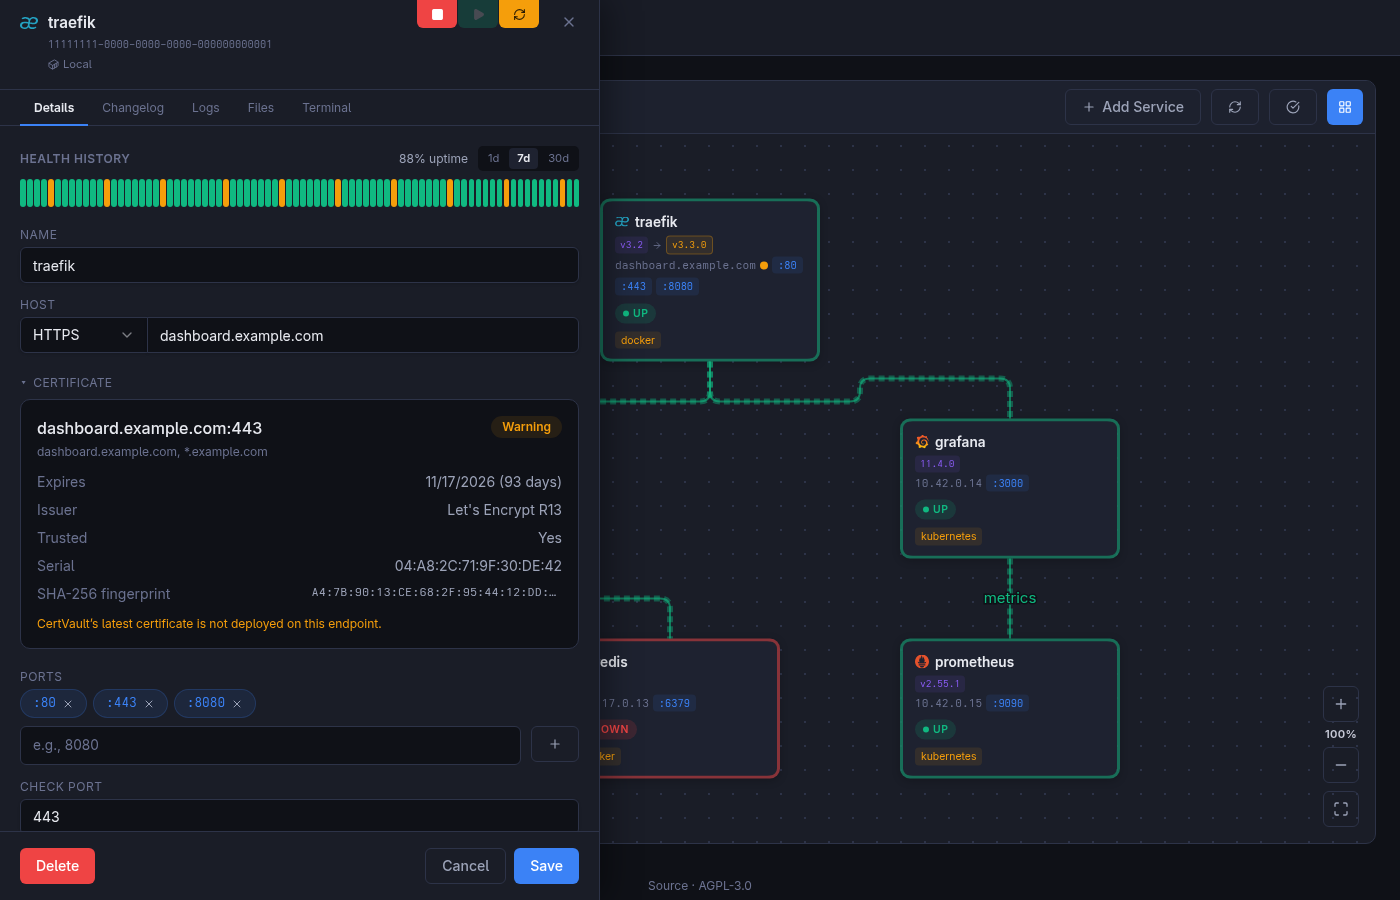
Health and certificate details
Section titled “Health and certificate details”Inspect recent health history alongside each service’s endpoint settings. For HTTPS services, DockDash shows certificate expiry, issuer, trust state, serial number, fingerprint, and CertVault deployment status.
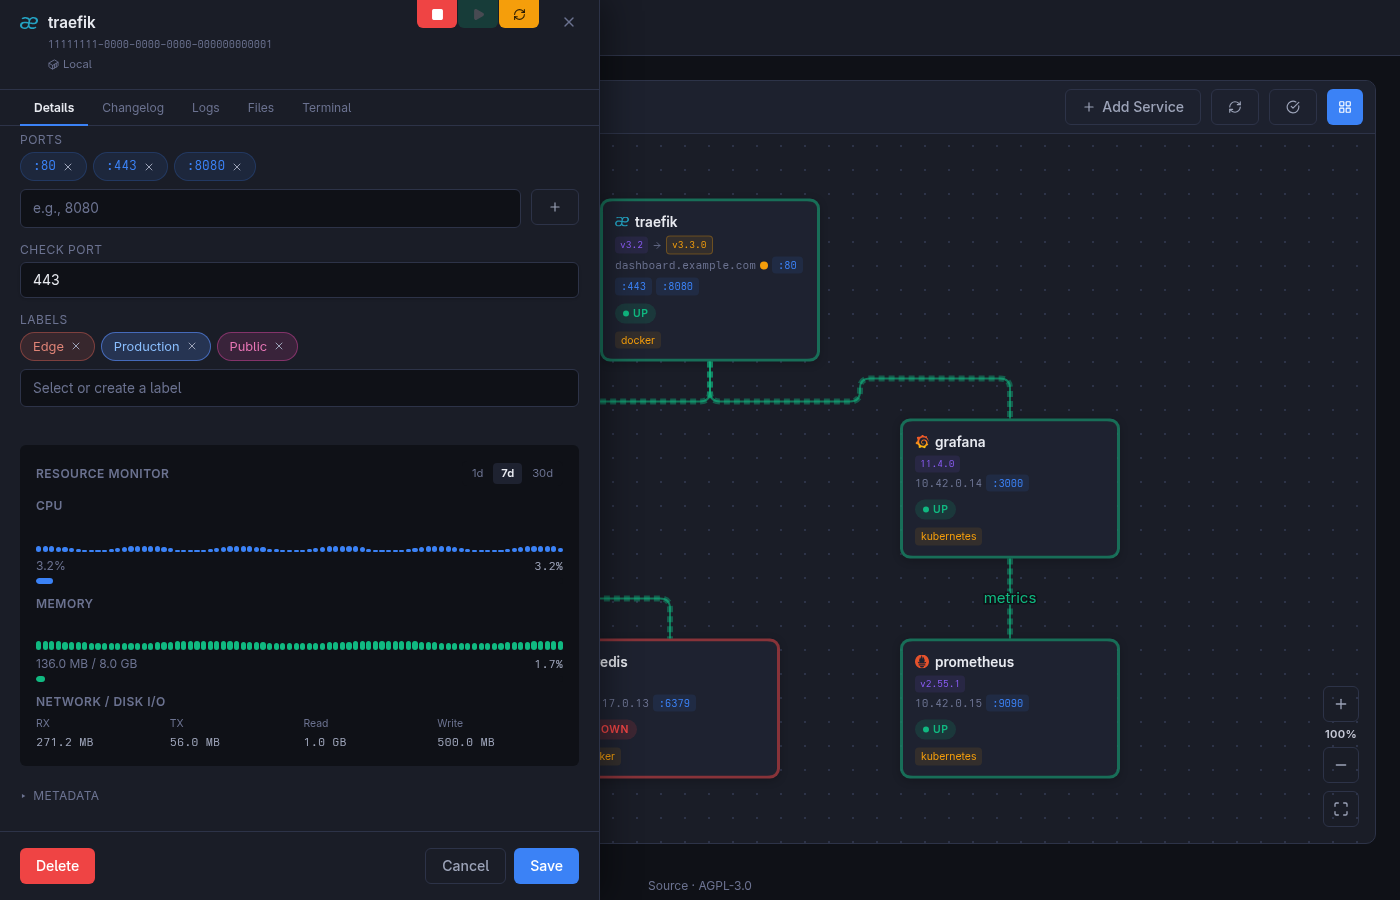
Resource history
Section titled “Resource history”Review current and historical CPU and memory usage, together with Docker network and disk activity, from the service drawer.
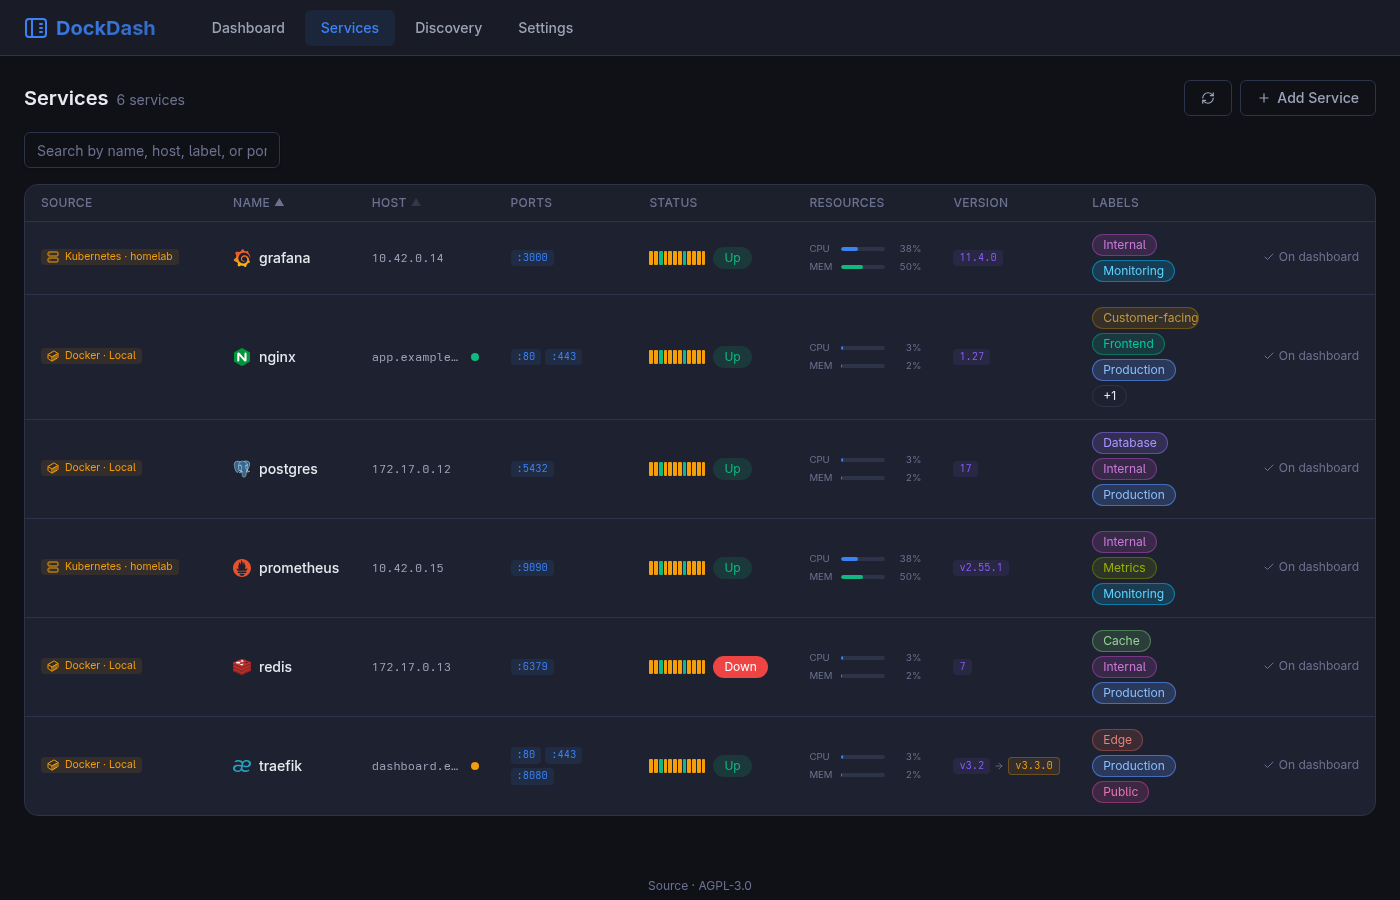
Service inventory
Section titled “Service inventory”The services table provides a compact inventory when you need to search, filter, sort, or compare everything at once. Add multiple reusable labels from a service’s edit drawer to organize the inventory; labels appear in the table and are included in search without adding visual noise to the topology canvas.
Updates with context
Section titled “Updates with context”For version-shaped image tags, DockDash finds compatible registry tags and reports the actual version transition. It then resolves the source repository and shows the matching GitHub release notes.
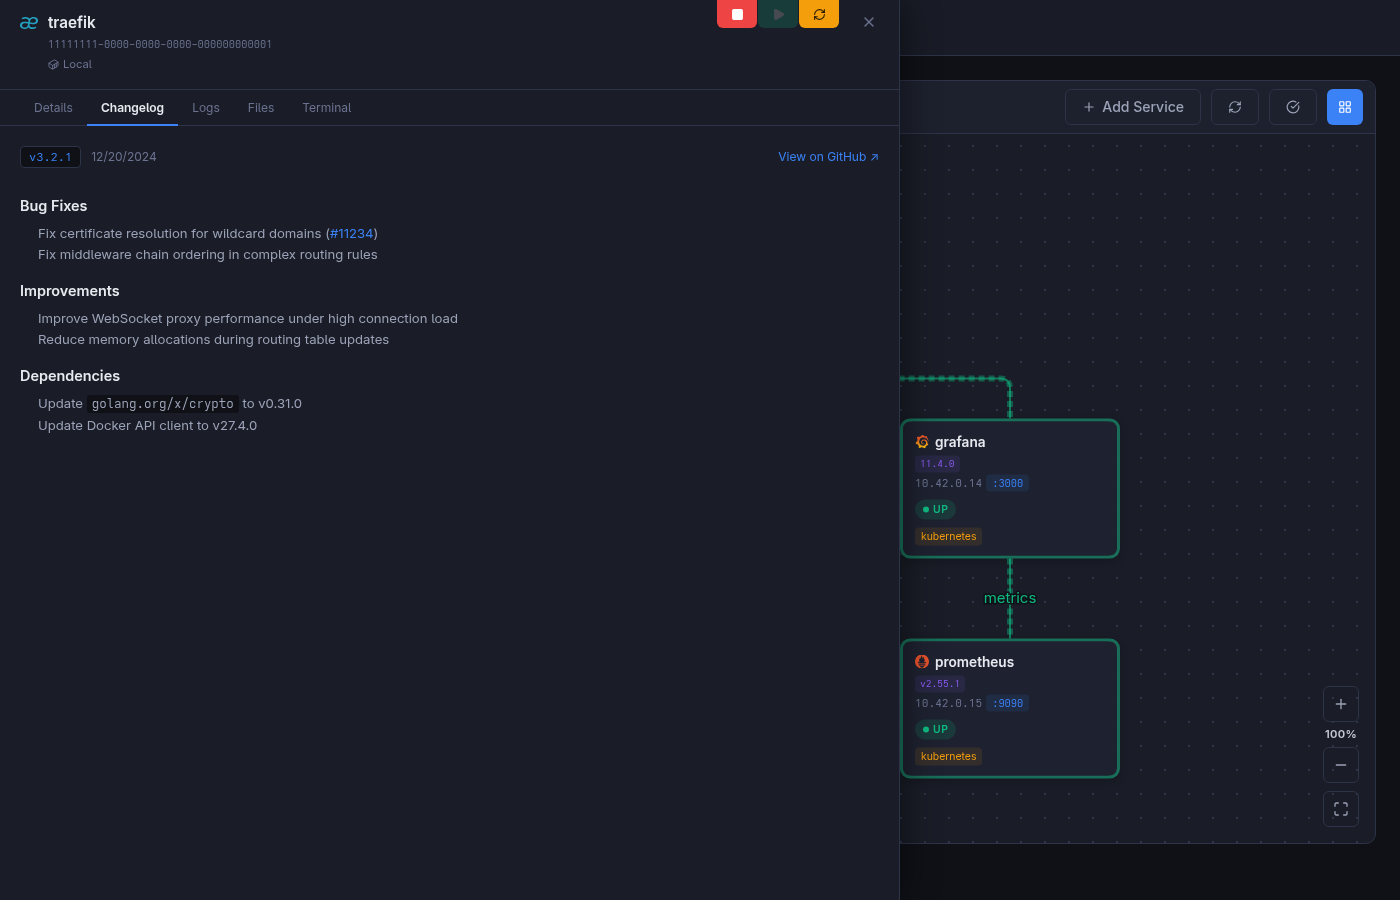
Floating tags such as latest, stable, and dev fall back to digest comparison, so mutable images are still monitored.
File explorer
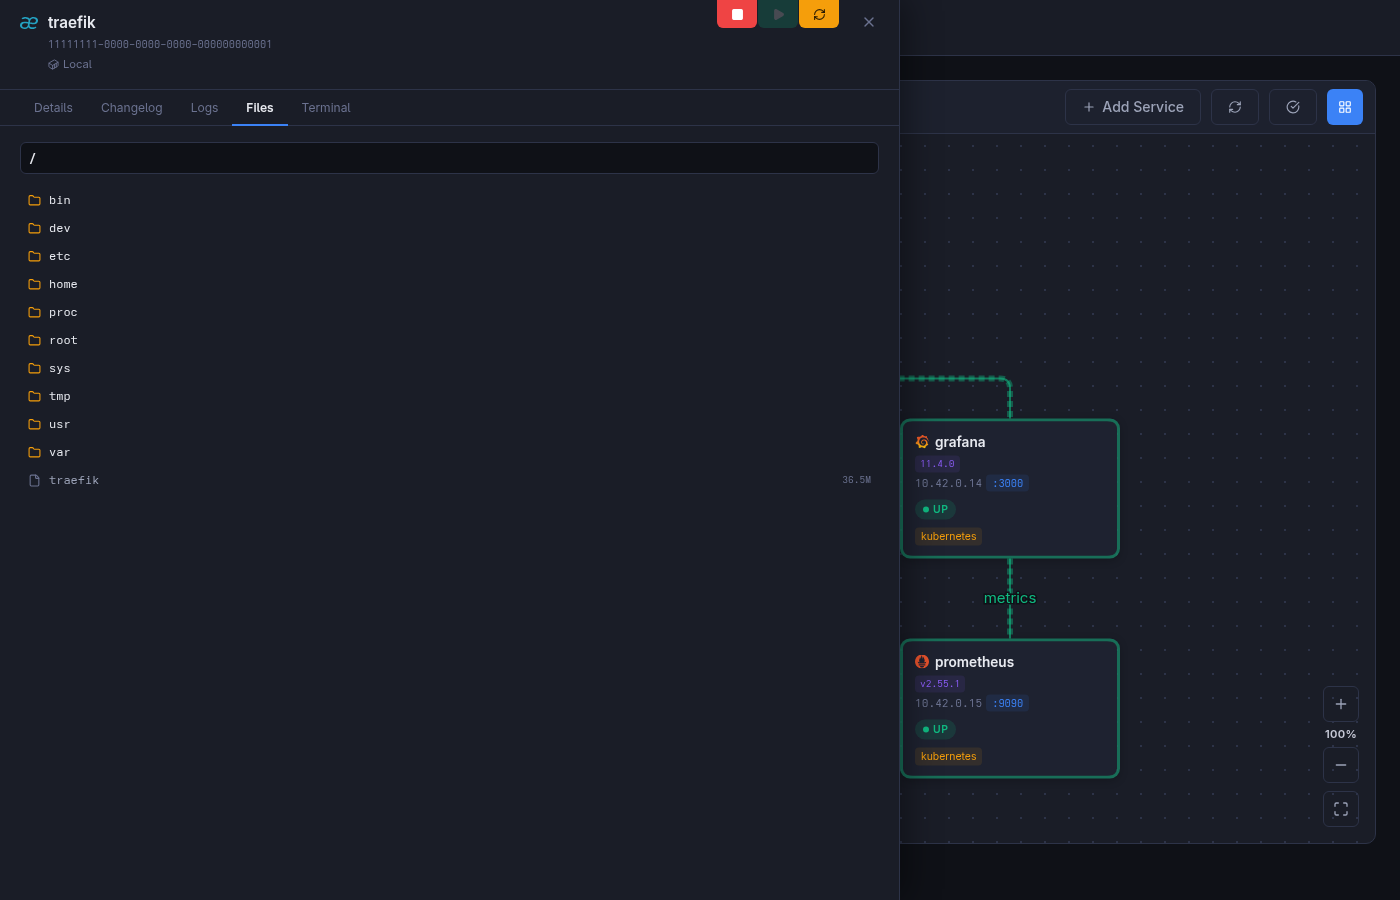
Section titled “File explorer”Browse container directories and inspect or edit text files without leaving DockDash. Available operations follow the tools and filesystem permissions inside the selected container.
Interactive terminal
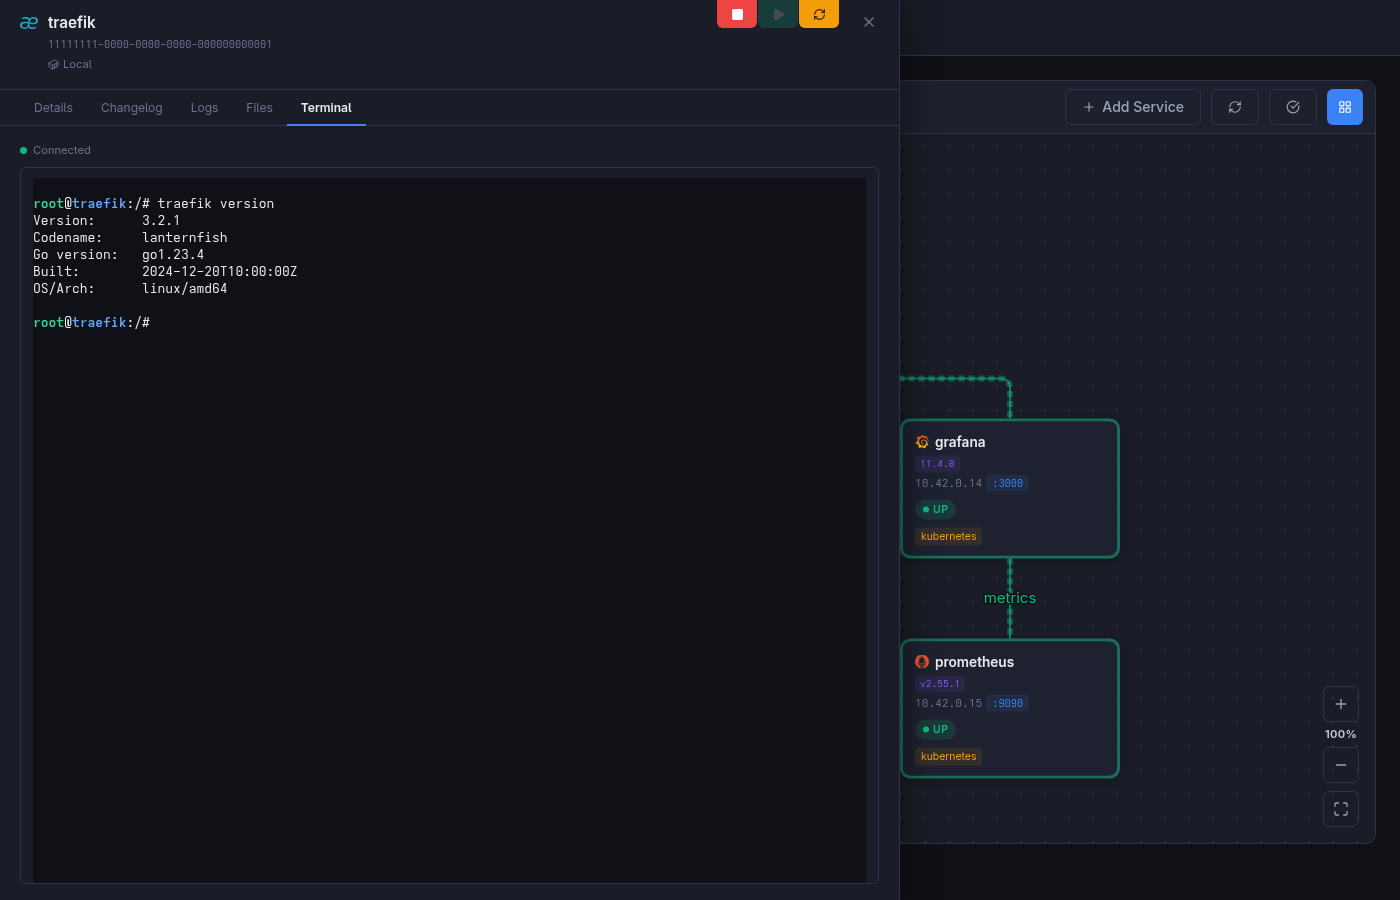
Section titled “Interactive terminal”Open a live shell inside a container directly from the service drawer. DockDash uses Bash when available and falls back to sh.
Integrations
Section titled “Integrations”DockDash supports: